

Most recruiting teams know how many people they hired, yet few know why good candidates turn down offers.
Without a measure for each step, you cannot tell whether the delay comes from your process or from the market.
This article shows which KPIs to track, how to calculate them, what US benchmarks look like, and how to build a dashboard.
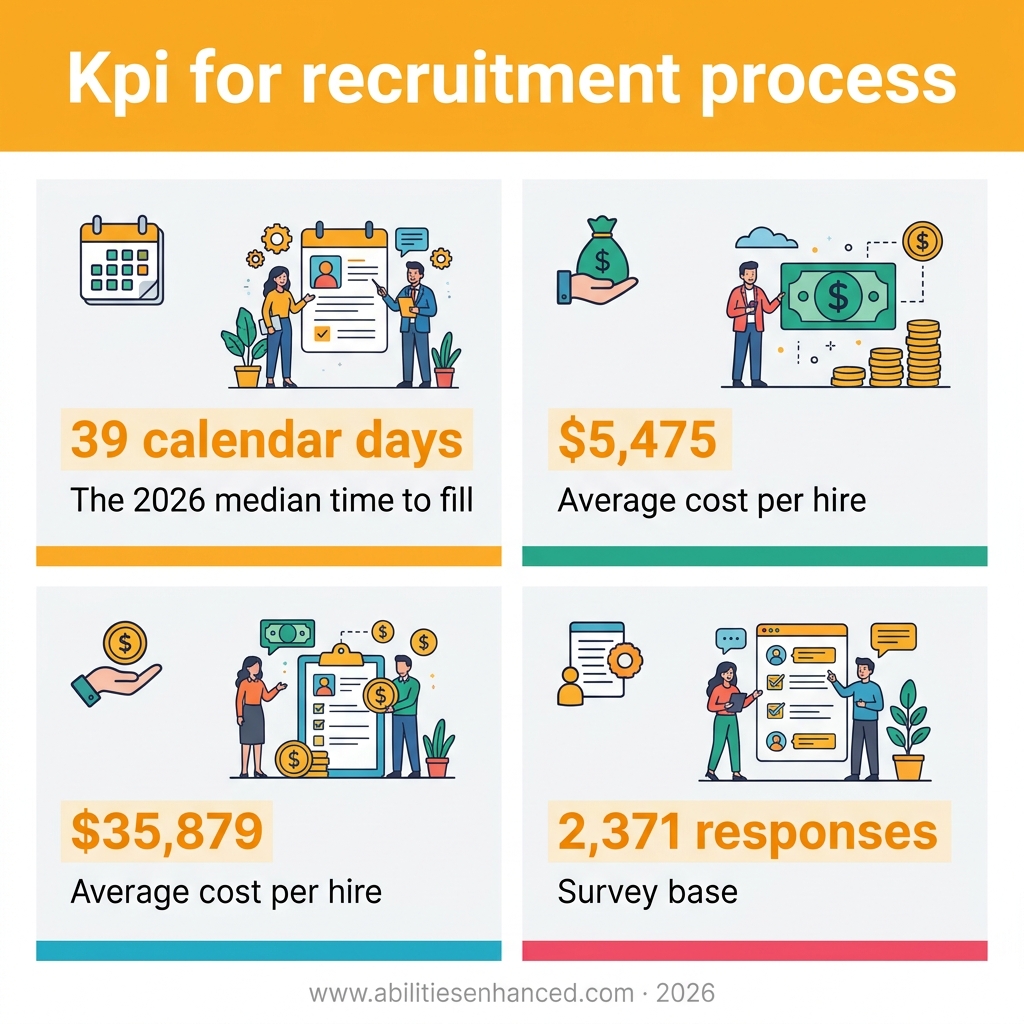
KPIs for the Recruitment Process Measure Speed, Quality, Cost and Candidate Experience
A recruitment KPI is a measure tied to one business question and one decision. Start with the question, such as why candidates turn down offers, then pick the metric that answers it.
A practical starting set has six measures: time to fill, stage conversion, hiring-manager acceptance, offer acceptance, cost per hire and quality of hire.
Speed and cost numbers can look good while a hire goes wrong. A fast, cheap hire tells you little if that person underperforms or leaves within months.
So read time to fill next to quality of hire, and cost per hire next to new-hire retention.
Core Recruitment Metrics and the Formula Behind Each One
Time to Fill and Time to Hire
Time to fill starts when the requisition opens and stops when a candidate accepts the offer, counted in calendar days. Time to hire starts later, when that candidate enters the pipeline, and stops at the same point.
The difference is the sourcing time before a candidate arrives. Use time to fill for the whole search, time to hire for the pipeline.
Stage Conversion and Offer Acceptance
Four formulas cover each step of the process:
- Time in stage: the date the candidate leaves the stage minus the date they entered it, in days.
- Stage conversion rate: candidates who advance from the stage divided by candidates who entered it, multiplied by 100.
- Hiring-manager acceptance rate: candidates accepted for the next step divided by candidates presented, multiplied by 100.
- Offer acceptance rate: accepted offers divided by offers extended, multiplied by 100.
Cost per Hire
Build cost per hire by adding internal and external costs, then dividing by hires in the same period. Do this for each source:
- Internal costs: recruiter pay and recruiting tools.
- External costs: agency fees, job ads, recruiting events and referral bonuses.
- Quality: a cheap source that brings weak hires is not a win, so read its cost next to hire quality.
Quality of Hire and New-Hire Retention
Set these before you compare any hires:
- Indicators: pick two to four, such as performance or manager satisfaction.
- Scale: put each one on the same range, like 1 to 5, then average them.
- Follow-up point: measure at a fixed time, such as 90 days after start.
- Retention rate: hires still employed at that point, divided by cohort hires, times 100.
What US Benchmarks Show for Time to Fill and Cost per Hire
According to the SHRM 2026 benchmark, the median time to fill for nonexecutive roles was 39 calendar days. Executive time to fill stayed unchanged from the year before.
Use these figures as reference points, not targets. Before you compare your numbers, check that the start date, end date, role type and reporting method match, and that you compare a median with a median, not with an average.
Both figures are attributed to a 2025 survey; verify the source, dates and respondent counts against the primary data before using them in reports.
| Criterion | Nonexecutive roles | Executive roles |
|---|---|---|
| Average cost per hire | $5,475 | $35,879 |
| Statistic | Average, not median | Average, not median |
| Survey base | 2,371 responses, Jan 9 to Mar 3, 2025 | Same survey |
| Weighting | Not weighted | Not weighted |
Choosing a Small Set of KPIs Tied to Real Decisions
Start from the business problem, then pick the metric that can test it. If hiring plans are at risk, track time to fill by role family: it shows how long open roles take to reach an accepted offer.
If early turnover is the problem, track retention at a point you set after hire, and compare it with your quality-of-hire score.
Keep the core set short: speed, cost, quality, candidate progress, and offer outcomes. Add a measure only when it answers a specific question.
Ask what you would do if a number moved. If the answer is nothing, move that measure to background reporting, where it stays available without crowding your dashboard.
Setting Baselines and Targets From Your Own Hiring Data
First, write down each KPI’s definition: its population, numerator, denominator, time window, and start and end events. Use the same definitions when you compare results.
Then set a baseline from several months of your own hiring data, and only then set targets. Review each KPI every quarter to check that it still drives a decision.
Apply these rules in every report:
- A skipped stage is not a pass-through, so it never counts as a conversion.
- Keep automatic rejections apart from rejections a person made, since they show different steps.
- Judge recruiters on the slate they present, not on manager decision speed.
- Review pipeline and time in stage weekly, quality of hire and retention quarterly.
Building a Recruitment KPI Dashboard That Different Audiences Will Use
Executive and Finance View
Executives and finance need four numbers: hires against plan, time to fill, cost per hire, and retention. Pull them from HR and finance records, which hold recruiter pay, tools, agency fees, job ads, events and referral bonuses.
Show the median next to the average for time to fill. A few very long searches pull the average up, so it can make typical hiring look slower than it is.
When the two differ a lot, check the long searches first.
Talent Acquisition Leader View
Talent acquisition leaders need to see which sources produce hires and where candidates drop out. Build these views from the applicant tracking system, which holds every stage, requisition and offer outcome.
Then filter by role family, recruiter, team, location and source. Compare only similar searches. A slow stage in one team then points to your process, not to a hard search.
Recruiter and Hiring Manager View
Recruiters need a weekly view of active candidates, stage moves, replies to outreach, and delays. Hiring managers need their own candidates and the reviews waiting on them. If a review sits too long, give it one owner who clears it.
Reply rates and stage conversion are leading indicators: they show candidates engaging before any hire.
Retention and quality of hire come later, so read them against these numbers. If offer acceptance falls, check pay, role fit, process speed and candidate experience.
Start with the business question you need answered, then pick the one metric that tests it. Write its definition down before you look at any number.
Then set a baseline from a few months of your own hiring data, and set targets only after. This week, pick one question from your current openings and write its definition down.
Frequently asked questions
What are the most common recruitment KPIs?
The most common recruitment KPIs are time to fill, time to hire, stage conversion, cost per hire, quality of hire, offer acceptance and source of hire.
Each one answers a different question, so start with the question you need answered before picking a metric.
How do I write a recruitment KPI?
Write it in four parts: the outcome, the group and time window, the formula, and the action the result should guide. Example: offer acceptance rate, nonexecutive hires, Q1, accepted offers divided by offers extended, multiplied by 100.
Is time to fill the same as time to hire?
No. Time to fill starts when the requisition opens, while time to hire starts when a candidate enters the pipeline.
Both can stop at offer acceptance, so check which start date your dashboard uses before you compare a number with a benchmark.
What is a good cost per hire in the US?
There is no single good number, but the 2025 US averages were $5,475 per nonexecutive hire and $35,879 per executive hire. Compare only roles of the same type, and set your target from your own cost trend.
Commentaires récents